
Another week. Another big drop in the stock market. For the week, the S&P 500 finished lower by -5.26%. In just the last two weeks, we’ve seen a drop of more than -10%.
As a reminder, a drop of between 10-20% is generally considered a “correction.” Corrections are typically driven more by market sentiment than anything fundamental. They usually happen very quickly and recover very quickly as well. I don’t know what next week will bring, but this seems like a standard correction to me. Which is healthy.
But what if it’s something worse? I’ve been asking myself that question lately. Especially because there are so many similarities between the current stock market and that of the “dot com” bubble of the late 90’s / early 00’s. Let’s compare and contrast a little.
The similarities between today’s market environment and that of the dot com era are striking:
Both were driven by big bubbles
From late 1998 until March 2000, the Nasdaq index (a good barometer of the internet stock craze) increased by well over 400%. Similarly, from March 2020 until February 2021, the ARK Innovation ETF (a good barometer of the recent disruptive innovation / crypto craze) increased by well over 300%.
Both bubbles popped in spectacular fashion
From March 2000 until April 2001, the Nasdaq index fell around -78%. From February 2021 through today, the ARK Innovation ETF has fallen around -76%.
Both of these bursting bubbles created a bear market
From March 2000 until April 2001, the S&P 500 entered a bear market after falling roughly -27%. From December 2021 through today, the S&P has also entered a bear market after falling roughly -23%.
And the bear market from the dot com era had legs. After the initial decline described above, it continued for another 17 months and an additional -26% decline. Should we expect that to happen today?
I don’t think so. There are some important differences between then and now:
Today’s market is bolstered by really strong companies
The top 10 companies in the S&P 500 cumulatively have around $1.4 Trillion of cash and short term investments. This is significant for two reasons:
1 – Strong balance sheets are usually viewed as safer companies and are not as prone to the kind of stock collapses seen in weaker companies
2 – A strong cash position helps these companies bolster thier stock prices. For example, if the price falls too low, they can use their cash to buy back shares, which applies upward pressure to their stock price.
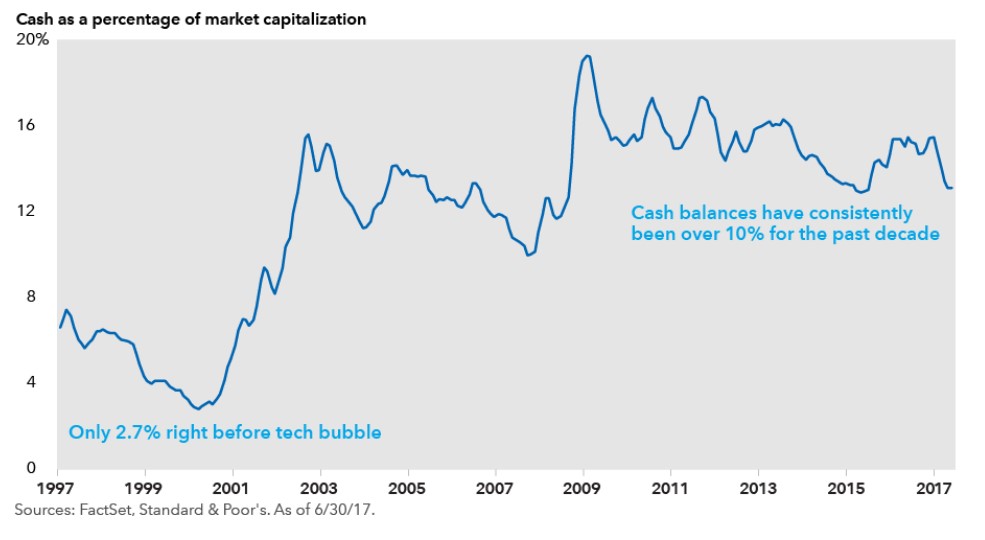
Right now, the top 10 companies alone have cash ($1.4 Trillion) that represents roughly 4.39% of total stock market value ($31.9 Trillion).
To put this into perspective, check out the chart below. Right before the tech bubble, all 500 S&P 500 companies had cash that represented just 2.7% of total stock market value.
Today’s stock market has much stronger financials than it did in the dot com era.
The Fed is ready to combat any further collapse
Recently, the Federal Reserve has been raising interest rates. This is their primary tool to fight inflation. You can read more about that – and my views on inflation – HERE.
On the flip side, cutting interest rates is their primary way of fighting deflation and/or a falling stock market. Since they’ve been raising rates all year, they have reloaded their ammo to fight any further collapse. And cutting rates typically results in a fast and furious stock market recovery. This would be disastrous to miss out on.
Just like last week, I’m staying calm and sticking to my plan.
*current cash on hand is an estimate and based on data pulled for each of the top 10 S&P 500 constituents on 9/23/2022