Happy Saturday, friend! I hope you are enjoying your weekend so far.
Apologies for the delayed newsletter today. My wife and I took a short trip this week to celebrate our 10th anniversary, and just got back last night. While on our trip, I resisted the urge to work. Instead, we focused on our gratitude and appreciation for one another. It was a much needed few days of rest and reflection!
Unfortunately, that meant starting from scratch this morning. Luckily, there has been a lot of big news in the stock market and economy recently. So hopefully the quality of content makes up for the delay in its delivery.
Strong Stock Market Performance Continues
The recent bounce in the stock market continued this week. The S&P 500 finished the week higher by +2.71%. And for the month of October, it has moved higher by +8.68%. And this has included some of the biggest “up days” we have seen in a while. Historically, the biggest “up days” tend to occur around bear market bottoms – often as a new bull market is forming.
Resiliency to “Big Tech” Headwinds
Additionally, this week saw resiliency in the overall stock market, despite awful performance for “big tech” stocks. This is significant because the overall stock market had become incredibly top-heavy over the past decade, given the rise of the so-called FAANG stocks (Facebook, Amazon, Apple, Netflix, Google). And you can throw Microsoft in there as well.
Basically, these stocks performed so well and got so big, that they were propping up the rest of the stock market. In fact, over the past decade, there had been several periods where the majority of stocks in the S&P 500 were down, but the overall market was still up. Thanks to the performance of big tech.
This year, we’ve seen the negative impact of this over-concentration. Much of this bear market has been driven by a reversal in sentiment around the tech sector. As stock prices of these companies have cratered, so has the stock market they were propping up.
But we saw a major break in this correlation this week:
- Meta (Facebook) dropped by -23.57% on the week, with a low point of -25.55%
- Amazon dropped by -13.77%, with a low of -17.57%
- Alphabet (Google) dropped by -6.24%, with a low of -10.67%
- Microsoft dropped by -4.66%, with a low of -8.69%
Despite this, the overall stock market was up for the week. This break in correlation is encouraging and could mark a turning point. It’s also a great reminder of why the stock market has always gone up over time.
Companies and industries will fail. But other companies and industries have always stepped in to pick up the slack. A well-constructed stock market index is designed to adapt and thrive. And so is your investment portfolio, if it is designed properly.
Inverted Yield Curve
A big negative development this week was the inversion of the “yield curve” (as measured by 3-month treasury yield, relative to 10-year treasury yield). Historically, this has been an accurate predictor of recessions. Because of this, many are now expecting a recession to occur sometime next year. And this could mean a further decline in the stock market.
Why has this been such an accurate predictor of recessions?
Normally, the interest rate on a 3-month treasury is much lower than the interest rate on a 10-year treasury. Why would anyone lock their money up for 10 years, unless they can earn a much higher interest rate in return? But when this yield curve inverts, the 3-month rate is actually higher than the 10-year rate.
And these interest rates have historically influenced borrowing and lending rates for banks. Typically, the 3-month rate is indicative of what a bank pays to borrow money and the 10-year rate is indicative of what a bank can earn on that money when they lend it.
When the yield curve is normal, a bank borrows at a low rate and lends at a higher rate. So they make a nice profit and are incentivized to increase lending. Increased lending means increased economic activity. When the yield curve is inverted, a bank borrows at a high rate and lends at a lower rate. So they lose money on that loan and are incentivized to decrease lending. Decreased lending means decreased economic activity.
Currently, the 3-month yield is 4.18% and the 10-year yield is 4.02%. Borrowing at 4.18% and lending at 4.02% is obviously not profitable.
So is a Recession on the Horizon?
While this yield curve inversion has been an accurate predictor in the past, there is a big difference now that I think many are either not considering or do not fully understand: the Fed’s “ample reserve” monetary policy. The Fed officially adopted this policy in 2019.
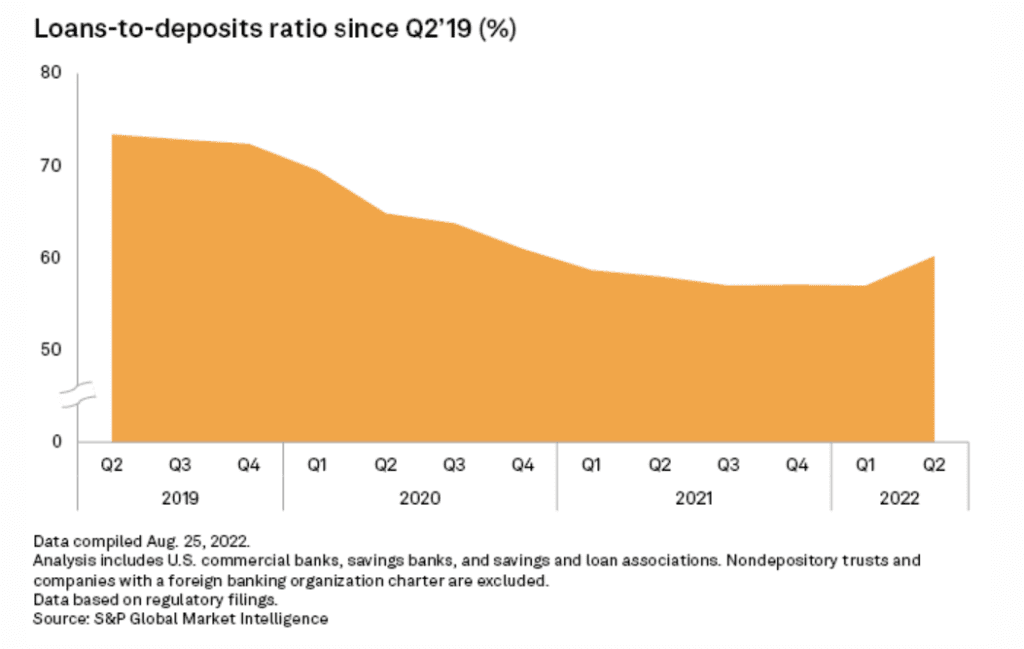
A major byproduct is that banks now have record levels of deposits and other cash on hand. Because they are so flush with cash, they don’t have to borrow money. And the national average savings account rate is only 0.16%.
So, lending is still very profitable for banks. This is why we are seeing an increase in loan growth. Increased loan growth tends to result in increased economic activity.
And the amount of loans, relative to the amount of deposits, is at its lowest level in years. Not only is lending profitable for banks, they also have plenty of room to increase the amount of outstanding loans. I’m not so sure a recession is imminent.