
Opening Commentary
As you know, the Reflective Wealth Global Growth strategy (RWGG) is designed with a long-term focus on growth. This is accomplished through a “core and satellite” approach.
The core of this strategy is an allocation to the overall global economy. We want this portion of the portfolio to simply provide us with “market” growth – which simply means growth that is in line with the overall global stock market, as measured by the FTSE Global All Cap Index.
The thought process behind this core allocation is simple. Throughout history, humans have created solutions that not only help us address problems, but also profit from them. Therefore, the global economy has always moved onward and upward over time, despite the occasional recession.
It’s reasonable to expect this to be the case going forward, as well.
Societal values will continue to evolve. Technologies will continue to advance. Businesses will fail and businesses will succeed. But this has always been the case because change is inevitable and constant.
After we establish our core position that reflects the global economy, we then build around it with “satellite” positions. These give us exposure to emerging industries and technologies that show potential to grow more than the overall global stock market over time.
_______________
“In 2023, FinTechs were hit hard with funding cuts and rising inflation, making smart, sustainable ways to grow become top of mind in 2024.”
_______________
The above is a recent quote from the founder and CEO of Plaid, Zach Perret.
Plaid is a FinTech (financial technology) company that facilitates data transfer in the banking industry – and it’s incidentally the software that allows you to link your bank accounts to your Altruist investment accounts, to facilitate deposits and withdrawals.
As you know, FinTech is one of six satellite positions in RWGG. However, I believe this quote is indicative of the business sentiment within all of our satellite positions.
Smaller, high-growth businesses tend to borrow a lot of money, in order to fund their growth initiatives. And ever since the Fed began hiking interest rates to their highest level in 15 years (and have since held them), borrowing costs have been significantly higher.
Hence Perret’s comments around funding cuts and inflation. And as a result, our satellite allocation to high-growth businesses (30% of the overall strategy) has been a drag on performance this year.
On the bright side, Perret also highlights the necessary shift to “smart, sustainable ways to grow.”
The high-growth businesses within our satellite allocation have endured a major transition over the past couple years.
When interest rates were near zero, it was easy to borrow and spend. Many of these businesses had a “growth at all costs” strategy during this time. The focus was less on profits and more on user adoption and revenue growth. And their stock prices were rewarded handsomely.
Now – with rates much higher now, they must be more selective in how much and for what reason they borrow. The focus is necessarily moving more toward profitability and value creation. And since this transition takes time, their stock prices have been punished.
This has been a significant lag on the overall performance of our investment strategy.
But it’s important to remember that the economy and stock market don’t need low rates to thrive. Throughout history, both have shown the ability to thrive, regardless of low or high interest rates. This is because smart entrepreneurs and business leaders have shown the ability to adapt to changing conditions.
A good business tends to make up for less borrowing / spending with more impactful borrowing / spending. Sure, some highly indebted companies will fail. This is even possible for some of the companies within our satellite allocation.
And this is exactly why we don’t invest in individual companies. But rather, we invest in thematic ETFs that give us exposure to an entire theme.
Regardless of inflation and interest rates, the overall industries and technologies in our strategy are likely to continue plowing forward, as winners emerge. And over time, we expect that the winners will more than make up for the losers.
With our investment strategy, patience is a key attribute for success.
When rates were abnormally low, the market got a little too optimistic about future growth. And as they moved a lot higher, the market got a little too pessimistic about future growth. Currently, market sentiment is basically flat thanks to uncertainty about where interest rates are headed from here.
Whether interest rates stay high or go lower is less important than simply having a little certainty around one or the other. This will help these businesses create the right strategy to propel them forward.
It’s important to remember that our strategy is designed to weather short-term challenges, while capitalizing on long-term trends. And it’s part of an overall financial plan that properly manages risks to ensure you can still meet your financial goals over time.
Economic Update
The biggest concern in the economy has been – and continues to be – inflation. And this is why the stock market’s biggest concern has been – and continues to be – interest rates. Higher interest rates have been the Fed’s tool to fight inflation.
As such, it’s important to understand what’s going on with inflation at the moment.
The rate of inflation has fallen significantly since peaking in 2022. However, it’s still not down to the Fed’s target rate of 2%. But it’s getting close, having clocked in at 2.8% year-over-year for the past three months (as measured by the Fed’s preferred inflation metric, the Personal Consumption Expenditures index).
Will it get down to the Fed’s 2% target any time soon? To understand this, we have to understand what is driving inflation at the moment.
As you can see in the following chart from the Federal Reserve Bank of San Francisco, today’s inflation looks much different than it did at the outset of the post-covid spike. Housing and services are driving nearly all of the current inflation.
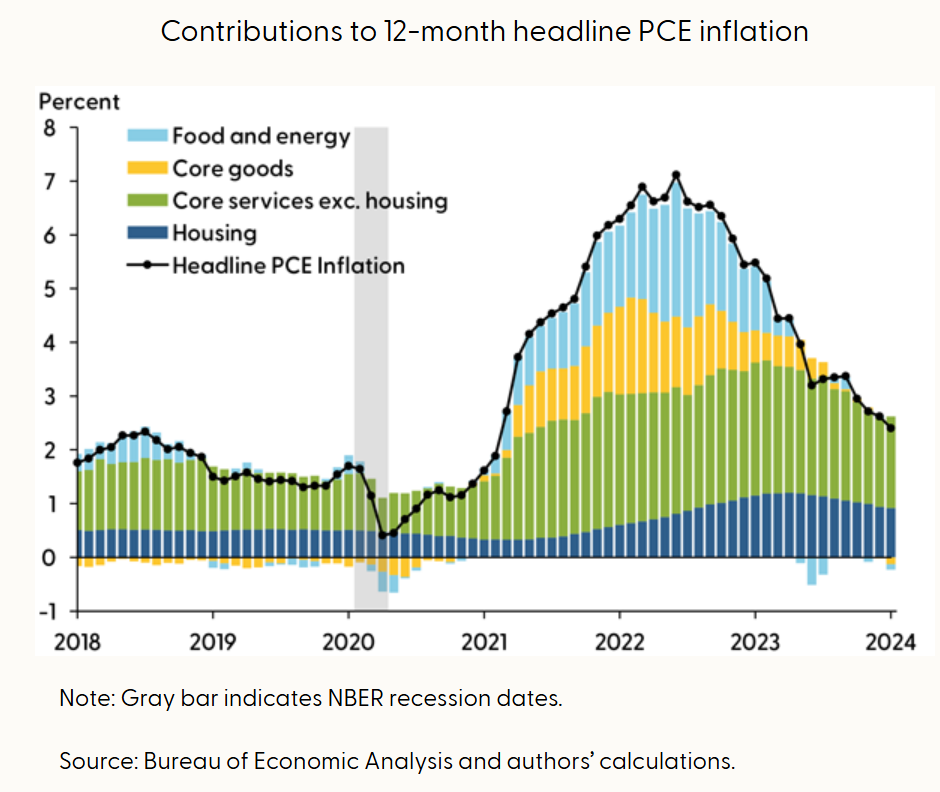
So, to determine whether inflation will get down to the Fed’s 2% target, we need to ask ourselves if housing or services inflation will start coming down.
Housing Inflation
Despite mortgage rates being around 7%, real estate valuations just aren’t coming down. As you can see in the following chart from the Federal Reserve Bank of St Louis, the median sales price of homes began leveling off when the Fed began hiking interest rates in March of 2022. However, they are still hovering near the highs.
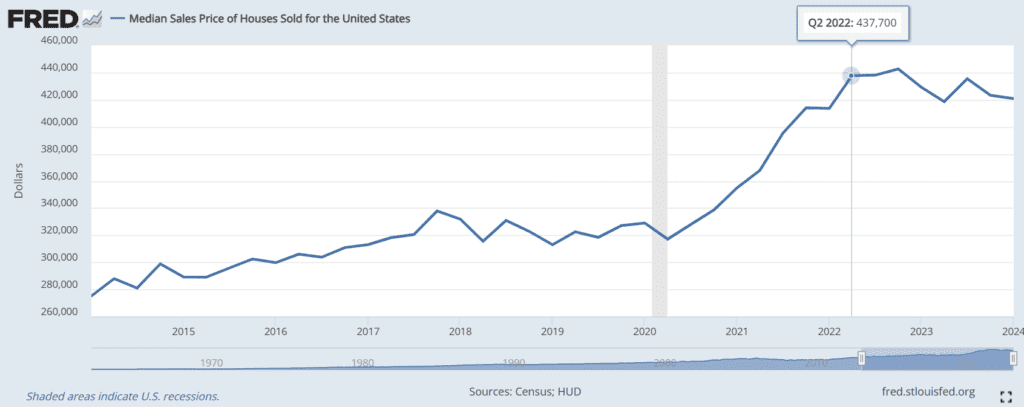
Why is this? You would expect higher mortgage rates to reduce demand for homes. After all, the more expensive it is to buy something, the fewer people that want to buy it. This decrease in demand generally leads to a decrease in prices.
But unfortunately, higher mortgage rates have also decreased the amount of sellers. Why would anyone want to sell their home, when it’s locked in at a 3.5% interest rate? To buy another home with a 7% interest rate?
And since there are fewer sellers, there are fewer homes available to buy. And this has the opposite effect of any lower demand from higher mortgage rates. If there’s less of something, it becomes more expensive.
Basically, any downward pressure on housing prices from lower demand has been offset by upward pressure on prices, thanks to higher supply. Hence the leveling off illustrated in the above image.
Will either of these competing forces give, causing housing prices to come down sufficiently?
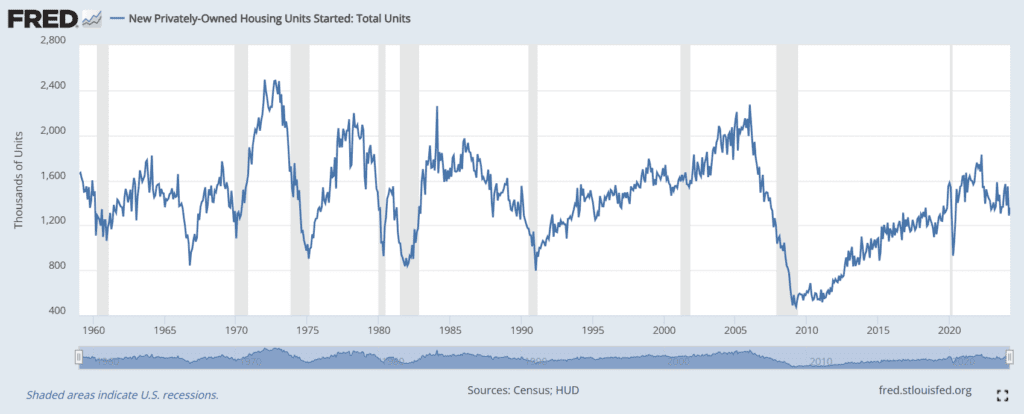
Nobody really knows. But I suspect it will take some time for this to happen naturally, if it happens at all. Because on top of these two competing forces, there’s another force that could push prices up higher: lack of new construction.
If people don’t want to sell their home, the only way to increase the supply for buyers is to build new homes. And as you can see in the following chart from the St Louis Fed, home building has been historically low for a long time. And we’ve only recently started approaching more normal levels.
In my opinion, we’d need this statistic to start moving much higher to bring housing prices down in any meaningful way.
Services Inflation
Consumer spending in the US can be broken down into two primary categories: goods and services. And lately the trend has been decreased spending on goods and increased spending on services.
According to the US Bureau of Economic Analysis, spending on goods has only averaged around $4 billion per month since September 2023. And in half of those months, goods spending decreased. This is why many retailers are now slashing prices on goods.
Meanwhile, spending on services has averaged around $82 billion per month. And every month has shown a significant increase.
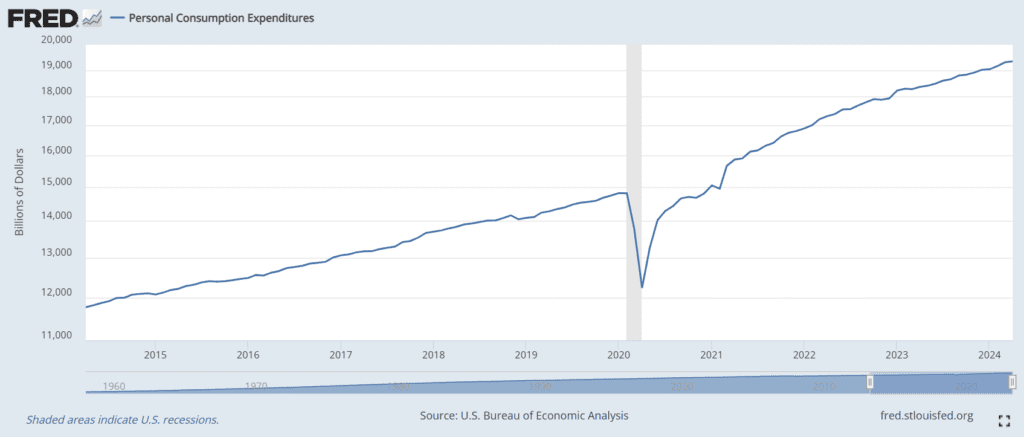
In order for services inflation to come down, consumers would need to slow their spending on services. I don’t see this happening.
As you can see in the following chart from the St Louis Fed – overall consumer spending continues to remain strong. The slowdown in goods spending doesn’t seem to be indicative of a slowing economy. It looks much more like a redirection of where consumers are spending their money.
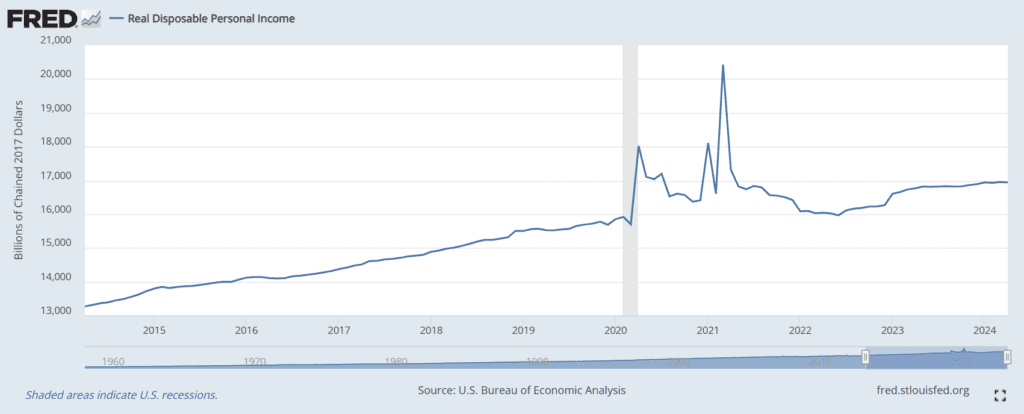
And as you can see in the following two charts, the consumer appears to be in great shape right now. Given this, you’d expect overall consumer spending to continue growing.
This first chart illustrates real disposable income. Which simply means disposable income adjusted for inflation. After the significant hiccup from covid shutdowns and stimulus payments, you can see we’ve settled back into a very normal growth trajectory. This means consumers continue to have more money to spend.
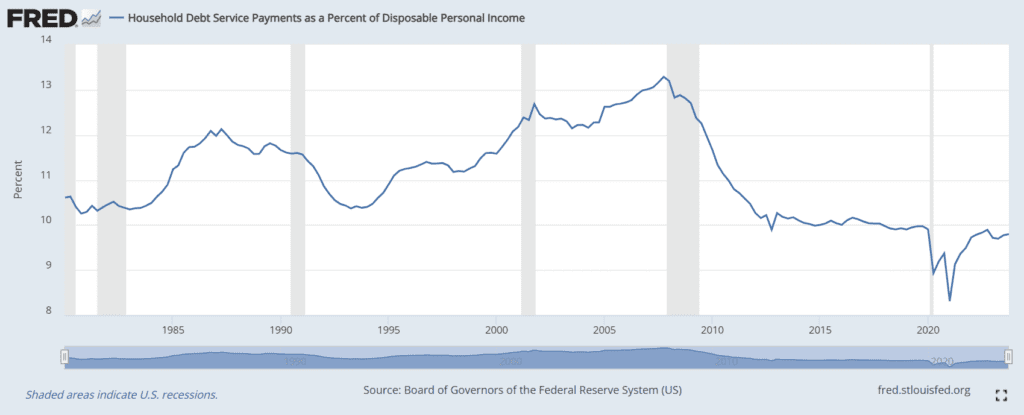
And this chart illustrates household debt servicing, relative to disposable income. In other words, how much of peoples’ disposable income is going toward debt payments?
As you can see, it’s at historic lows. So, not only does the consumer have more money to spend, they also have more room to borrow (and aren’t being hurt too badly by higher borrowing costs).
The strong position of the US consumer tells me not to expect any rapid decline in services inflation any time soon.
Stock Market Update
Despite the tough business environment that high rates have created for many companies – particularly those in our satellite allocation – the major stock market indices have been on a tear. In 2023, the S&P 500 was up more than +24%. And so far in 2024 (as of 6/17/24), it is up nearly +15%.
Why is this the case? The answer to this question is a good reminder of why I believe the S&P 500 is a really bad benchmark to consider for a long-term investor.
Stock Concentration Risk
For one, it’s a “cap-weighted” index. This means that the largest companies within the index have the highest level of representation within it.
And because of this, concentration can often occur at the top. Which can result in a small number of companies disproportionately driving the entire index. This is precisely what is happening at the moment.
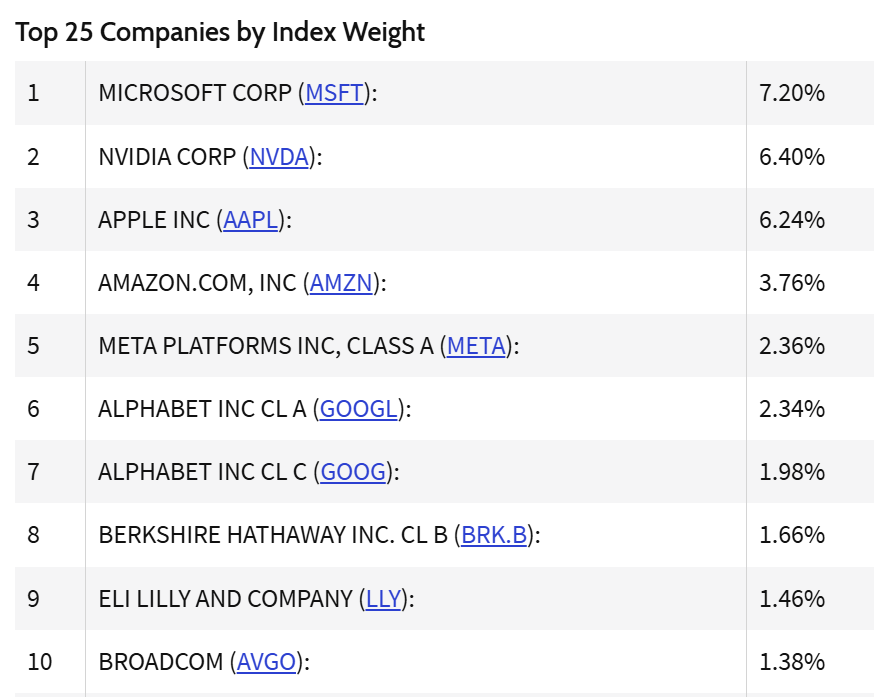
As you can see in the following table from Investopedia, the top 10 stocks currently account for around 35% of the overall S&P 500.
And as you can see in the following chart from Apollo Global Management, this concentration at the top is currently at the most extreme level in modern history. It’s even higher than it was at the height of the 90’s “dotcom” bubble, which ultimately led to a major stock market crash and a prolonged bear market.
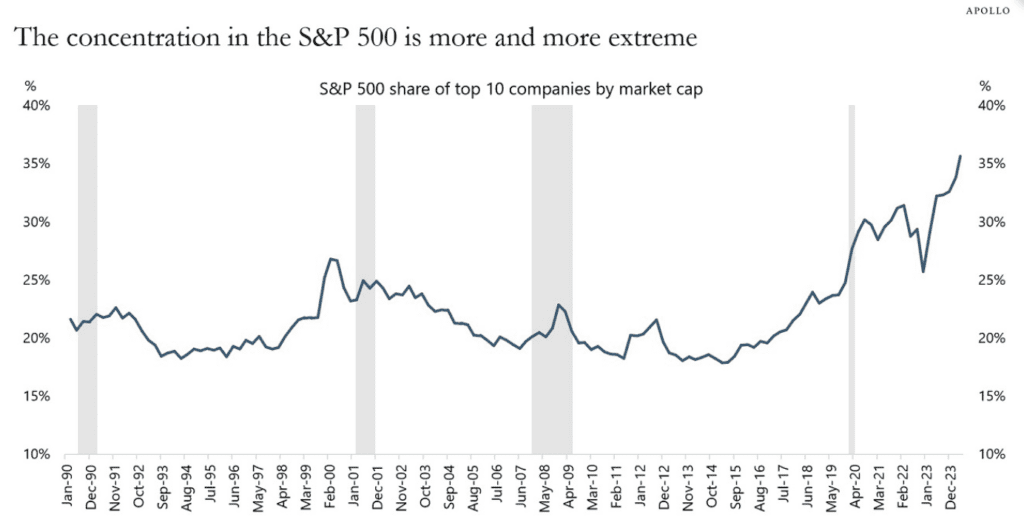
Does this mean that another crash is imminent? Of course not. There are so many economic and market variables that come into play to determine the fate of the stock market. But this is certainly a red flag for the S&P 500 and large US stocks, in general.
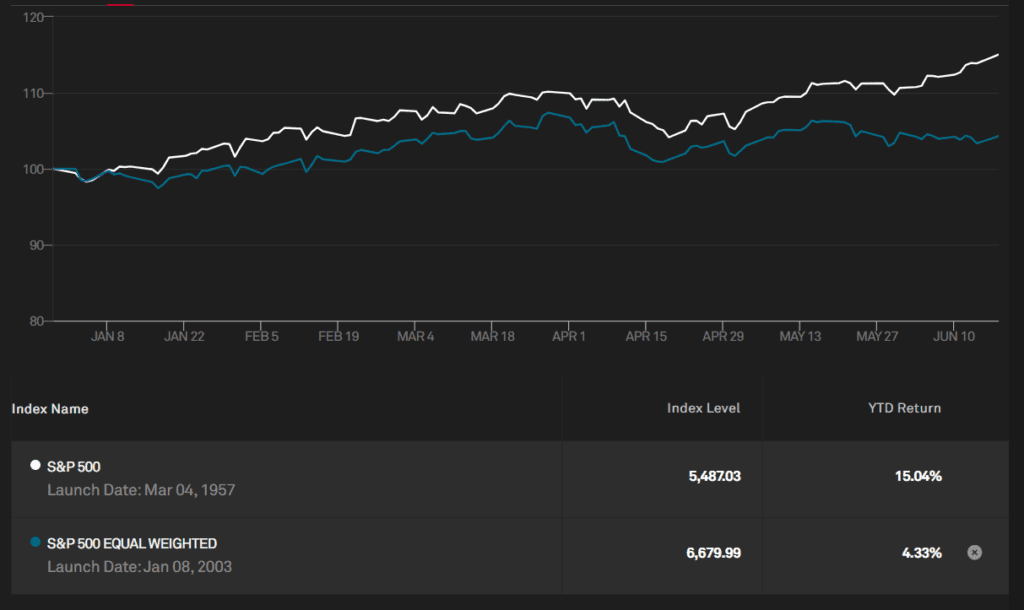
This concentration is also why the S&P 500 has – and continues – to perform so well. And this can easily be illustrated by looking at a performance comparison of the S&P 500 versus the S&P 500 equal-weight index.
As the name implies, the equal-weight index is not cap-weighted. In this index, each of the 500 companies are equally represented. Which means that each of these stocks only represents 0.2% of the overall index. Therefore, the top ten only represents 2% of the overall index, rather than 35%.
As you can see in the following comparison from S&P Global, concentration has helped the S&P 500 gain nearly four times that of the equal weight index just this year.
Market Cap Concentration Risk
Another reason the S&P 500 is a poor barometer is because it only consists of the largest companies in the US. As a result, it doesn’t provide an investor with any exposure to small companies.
The size of a company is referred to as its “market cap” and – depending on a company’s size – their stock is considered to be small, mid, or large cap. Over time, it’s important for a properly diversified investment portfolio to have exposure to all sizes of businesses, not just the largest ones.
In fact, according to this report from Wellington Investments, small cap stocks have significantly outperformed large cap stocks over time. The report highlights that – since 1927 – small caps have beaten large caps by an average of 2.85% annually.
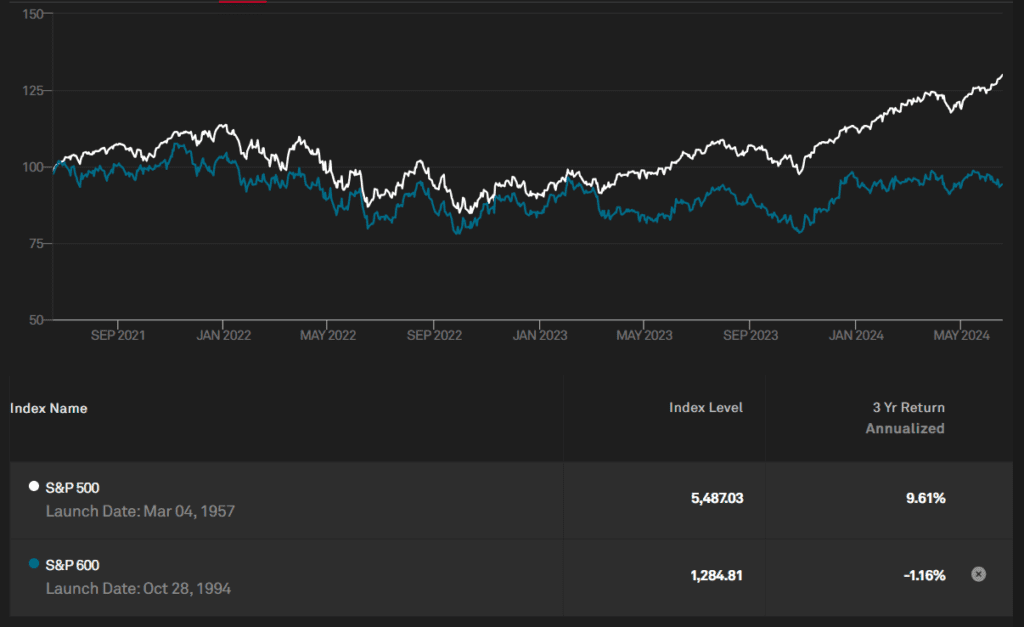
However, as you can see in the following chart, small caps (as measured by the S&P 600 small cap index) have been significantly lagging the large-cap S&P 500 for quite some time now.
And if you take a look at the next chart from the above-linked Wellington report, the underperformance of small caps doesn’t seem to be totally justified.
Yes – as I stated at the beginning of this letter – higher interest rates make it more costly for small businesses to borrow money and grow their businesses. However, this doesn’t necessarily mean that they become unprofitable.
When we compare the price of small cap stocks to the earnings of the underlying businesses, small caps have not been this undervalued since the dotcom bubble.
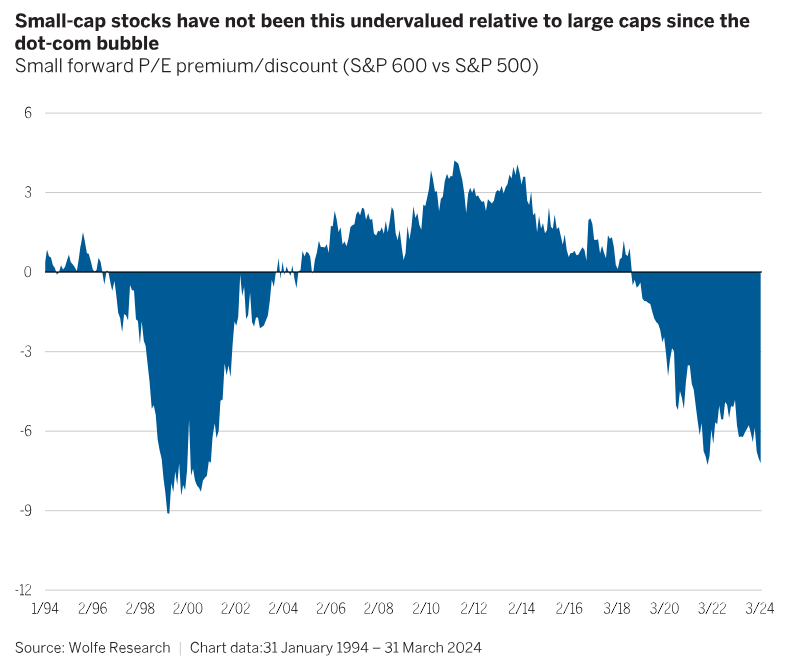
And interestingly – after the dotcom bubble popped and the S&P 500 crashed – small cap stocks held up quite well.
I’m not saying the S&P 500 is going to crash again. And I’m not saying small cap stocks will hold up again, if it does. But knowing this certainly doesn’t hurt the case for having small cap stocks as part of an intelligent long-term investment strategy.
United States Concentration Risk
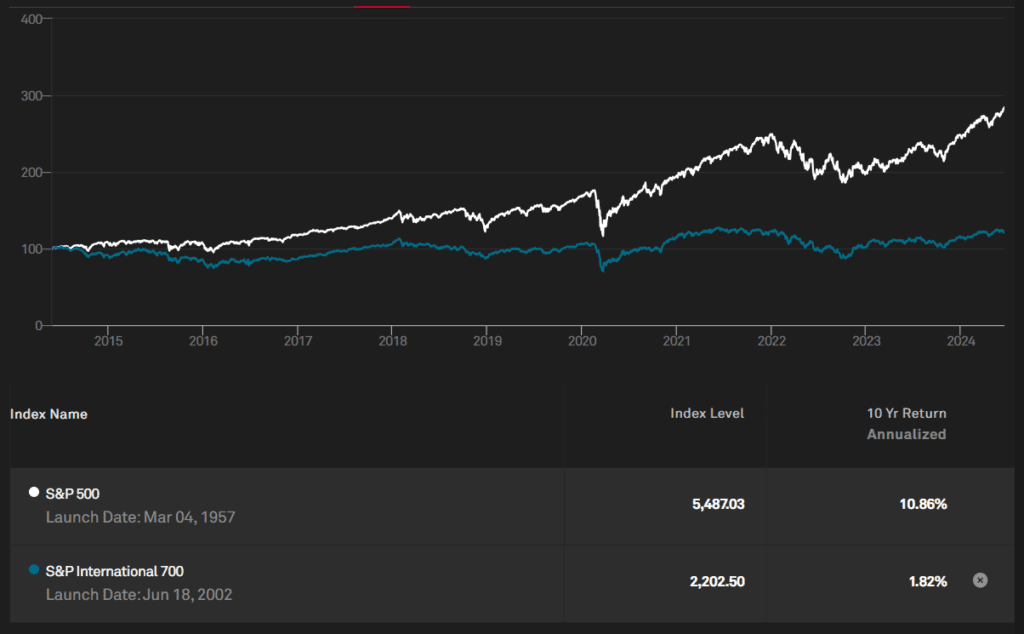
Furthermore, the recent run of good stock market returns have been pretty isolated to the US stock market. As you can see in the following chart, international stocks (as represented by the S&P International 700 stock index) have also significantly underperformed the S&P 500. And this has actually been a consistent long-term trend.
Historically, US and international stock performance have been cyclical. Any time we’ve experienced a long stretch of outperformance by one over the other, the cycle eventually reverses.
And while we don’t know when or if a reversal could happen in the future, it’s clear that the recent stretch of US outperformance is one of the longest on record.
As you can see in the following chart from Hartford Funds, US stocks have been beating international stocks on a rolling 5-year return basis for over 13 years!
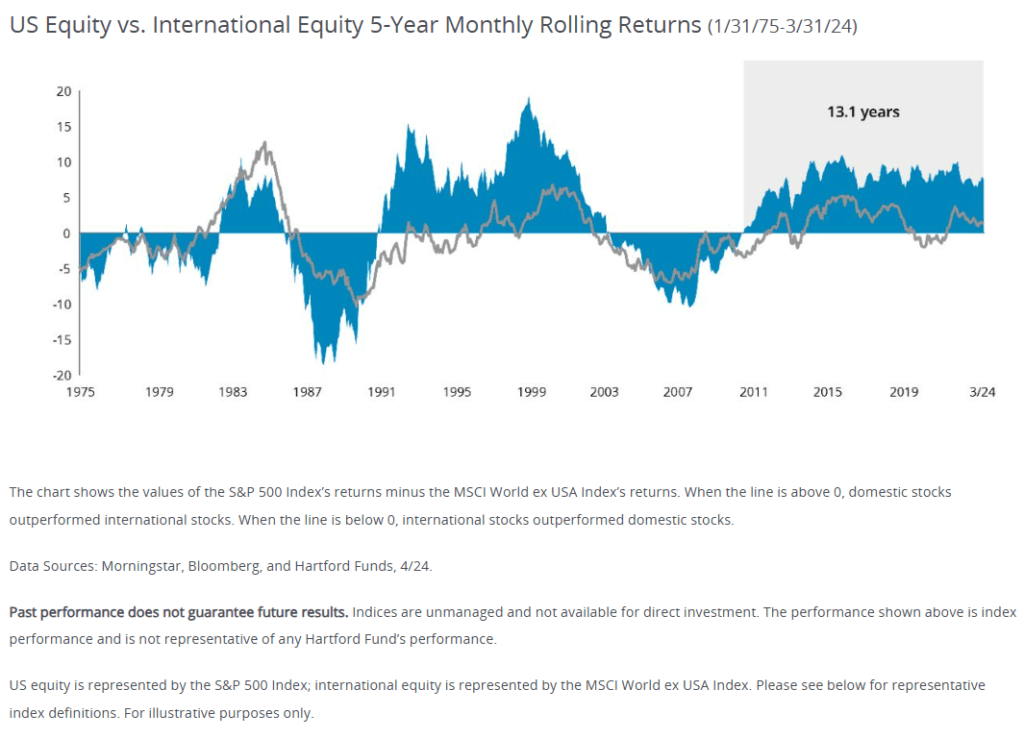
And oddly enough – the last time international stocks lagged behind so badly was (once again) in the years leading up to the dotcom bubble.
Which makes sense. When everyone in the world wanted to buy US internet stocks, there was a lot less demand for international stocks. Seems eerily similar to the current demand for US artificial intelligence stocks, doesn’t it?
Once again, I’m not trying to make predictions about what is going to happen now. But an understanding of how these cycles have played out in the past can be helpful in managing expectations going forward.
And it doesn’t hurt the rationale for having international stocks as a permanent part of a properly diversified long-term investment portfolio.
Summary
So far in 2024, the Reflective Wealth Global Growth strategy has underperformed its benchmark, which is the FTSE All World Stock Index.
Year-to-Date Returns (as of 5/31/2024)
The RWGG “core” allocation to the global economy (60% of the strategy) is designed to provide returns that are in line with this benchmark. Therefore, the primary driver of the underperformance has been the “satellite” allocation to emerging industries and themes (30% of the strategy).
These emerging industries and themes inherently consist of smaller, high-growth businesses. And these types of businesses tend to borrow money to fund their growth. Higher interest rates have weighed heavily on market sentiment toward these businesses.
Going forward, it doesn’t appear as though interest rates will move meaningfully lower in the near term. As a result, it’s unlikely that this part of our portfolio will see any meaningful surge in valuations from interest rate cuts – at least not in the near term.
Although if the market simply gets some certainty around where interest rates will be for the foreseeable future, this could lead to a steady and sustainable recovery in this part of our strategy.
Because – as we discussed earlier – business leaders have historically shown the ability to adapt to changing conditions and thrive. And the overall themes in our strategy – Clean Energy, FinTech, Cybersecurity, Genomics / Healthcare, Cannabis, and Disruptive Innovation – are likely to continue plowing forward.
As a result, winners will likely emerge in the coming years and keep the long-term investment thesis intact. And if the current economic outlook changes – prompting the Fed to cut rates sooner or lower than expected – I’d anticipate these types of stocks to come back into favor more quickly and become a tailwind for the portfolio.
Regardless, this is a long-term investment strategy that is designed to capitalize on these short-term developments. Our automatic rebalancing strategy has allowed us to accumulate more of these underperforming positions, since we still have conviction in their long-term merits. Which is intended to benefit the strategy longer term.
The strategy is also positioned quite well for the following potential mean reversions:
1) A broadening of stock market leadership away from just a small handful of the largest companies in the world. Because our strategy is approximately 26% small and mid cap stocks.
2) A shift from US stock leadership back to International stock leadership after a historic stretch of over 13 years. Because our strategy is approximately 32% international.
As Sir John Templeton once said, the four most dangerous words in investing are “this time it’s different.”
It’s possible that this time is different. And that the historic levels of concentration within the stock market will continue for many years to come. But I don’t think it’s probable.
Most importantly, we need to always remember that this investment strategy is held within a comprehensive financial plan that gives you a high probability of reaching your financial goals, whether we get it right or wrong. We need to stay the course, make adjustments as needed, and let long-term compounding work for us.
This article uses forward-looking language. There can never be a guarantee that any forward-looking statements will turn out to be accurate. All third-party information presented in the article is from sources that are thought to be reliable, but no representations are made by Reflective Wealth as to another parties’ informational accuracy or completeness. It’s always important to understand that when it comes to investing, everyone can get it wrong. Even the most seasoned investment professionals. This is why having a personalized financial plan in place is critical. It can ensure your financial security regardless of outcome.