
The stock market has been on quite a run since October. After setting a new closing low of 3,577 on October 12th, the S&P 500 has roared back. The latest closing price on
Friday was 4,070 – or a gain of nearly +14% since that low point. Additionally, we are now up +6.02% in January, which is on pace to be the best month since this rally began in October.
Bear Market Rally or New Bull Market?
If you’ve been reading the newsletter for a while, you certainly know my take on this. But to review, many pundits have – and continue – to claim that this is just a bear market rally. Meaning a brief rise in valuation, until the bear market resumes and the stock market goes lower again. Back in October, I forecasted we were in the early stages of a new bull market and I continue to believe this.
My rationale is simply that expectations got too low. And when future reality exceeds expectations – even by a slight margin – the stock market tends to go up. If you haven’t read my posts on this, you can do so here and here.
Since then, I continue to see additional clues that we are in the early stages of a new bull market. The following are some of those clues.
Sustained Rise Since October
Many have compared the current rally in the stock market to the bear market rally in July. But looking back, that was an obvious bear market rally. It was an abnormally large bounce, sandwiched within a sustained downturn. Whereas the current rally looks like it’s part of a more sustainable uptrend.
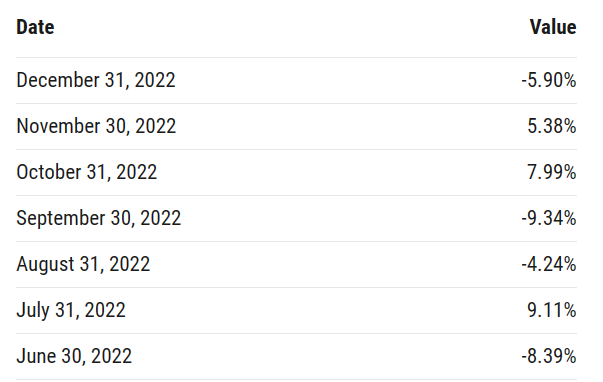
The S&P 500 jumped by over +9% in July of last year. But from June through September, three out of the four months were down – two of them by pretty large margins.
On the other hand, from October of last year through (almost) the end of January – with the S&P 500 up by +6.02% month to date – three out of the four months will have been up.
The table below, courtesy of ycharts.com, illustrates this:
Buy the Dip Mentality
Market sentiment – or the cumulative emotions of market participants – is important to monitor over time.
During a bear market, it is common to see a “sell the rally” mentality. This is why we get the aforementioned “bear market rallies.” When the market collectively believes more downside is ahead, it makes sense to sell rallies. Meaning, taking some profits while you can – before the bottom falls out again.
On the other hand, during a bull market, it is common to see a “buy the dip” mentality. When the market collectively believes more upside is ahead, it makes sense to buy dips. Meaning, accumulating more at lower prices – before prices shoot up even higher.
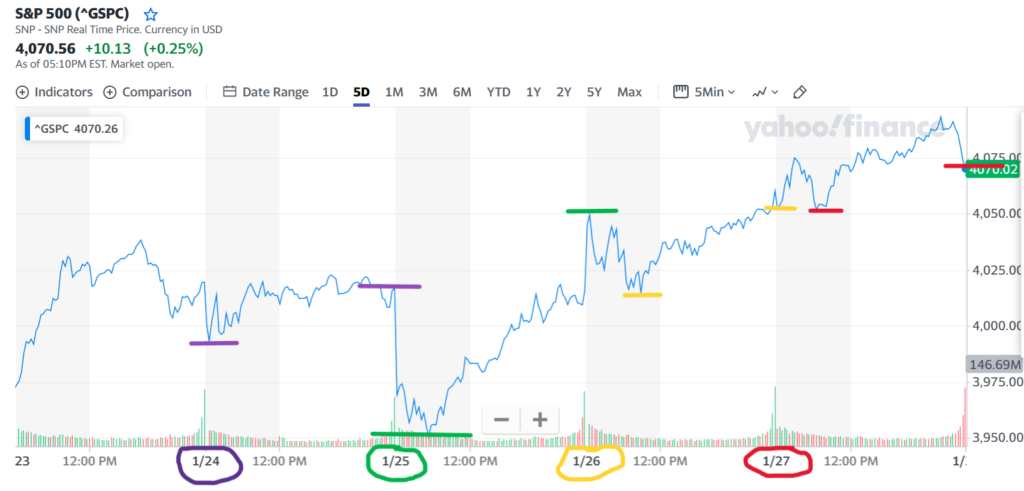
This week saw some pretty dramatic “buy the dip” sentiment, which is another clue to me that we are in a new bull market. As you can see in the chart below, the S&P 500 was up nicely on Monday. But that was followed by a big dip.
And every day for the rest of the week saw a dip in the early part of the day. And every time, the dip was bought and the market moved on to a new high. This is classic bull market behavior.
Solid 4th Quarter GDP Growth
The economy – as measured by Gross Domestic Product (GDP) – grew by +2.9% during the 4th quarter of 2022. This was better than consensus expectations.
And at 2.9%, the economy was right in the sweet spot during the 4th quarter, which is often considered to be between 2-3% growth. Is this really the sign of an economy that is on the verge of a recession?
Maybe. But, in order for a further stock market decline, I believe a recession would have to be worse than expected. And considering everyone on Earth expects a recession this year and has prepared for it, I think there’s a good chance things turn out either about the same or better than expected. Both of which would likely be good for the stock market.
I Could be Wrong
As always, I know I could be wrong. And as always, I don’t base my investment strategy on what I believe will happen in the short term. If you would like more information on my longer-term investment process, you can click on the link below in my disclaimer.
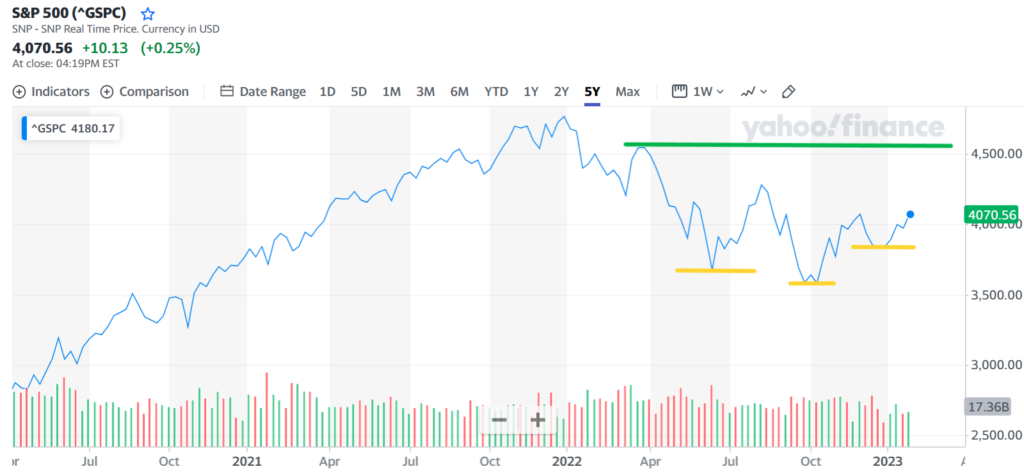
That being said, one thing I will be watching closely in the coming weeks and months is whether the S&P 500 can complete an “inverse head and shoulders” formation. This is a type of “technical analysis” which can sometimes be a good measure of market momentum, which is generally driven by sentiment. Simply put, the inverse head and shoulders formation often forms at the end of a long downtrend, signaling a reversal to a new uptrend. It can be defined as three consecutive low points, with the lowest one being in the middle.
As you can see in the following chart, it appears that this has been forming. But we would have to get back to the green line to complete the formation (which is only another +11.5% higher than where we stand today). At that point, I think there would be universal agreement that we are in a new bull market that could last a long time.
But for now, if it looks like a bull, acts like a bull, and gains like a bull, who am I to say it isn’t a bull? If it feels to me like a bull market, it probably feels like a bull market to a lot of other people. And since the stock market is simply a massive collection of humans, feelings and emotions matter. Because they often catch on and become a self-fulfilling prophecy.