
It’s been a tough year so far, for both the economy and the stock market. This is not news to you.
But what might be are all the reports of layoffs we’ve been seeing lately. And many analysts are forecasting more to come. Let’s face it, a rise in unemployment is never a good thing for the economy.
However – as counterintuitive as it may seem – I’m not too worried about my investment portfolio.
So – just in case you’re a little anxious – I thought it would be helpful to share some insights as to why. In particular, I’ll be focusing on how the stock market has historically performed during recessions with rising unemployment.
After doing some research, I’ve compiled my data into the table below. I looked at each of the six recessions the US has experienced over the last 40 years.
I looked at the S&P 500 price level at each of the following intervals:
- At the beginning of the recession
- When the unemployment rate reached its highest level
- 5 years after the beginning of the recession
- At the next market peak, just before the next bear market
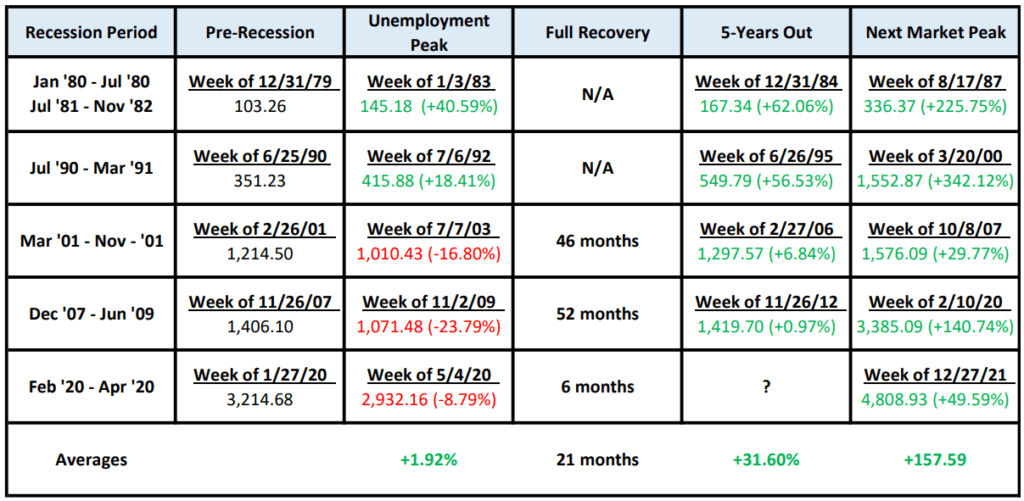
As you can see, 1980-1982 was actually a double whammy. Two recessions in less than two years. But many consider this to be one “recessionary period.”
Are you surprised to see that, overall, stock market performance wasn’t too bad during these periods? This is a good reminder that the stock market is typically a leading indicator of the economy, as I’ve discussed before.
When the market anticipates an improving economy, the stock market tends to go up. That’s why new bull markets typically begin when the economy is in rough shape.
Here are some of my thoughts on how this applies to the current situation we are in:
- On each of these occasions, patient investors experienced a gain in the 5 years after the start of the recession: +31.60% on average. And the 2001 and 2007-09 recessions were accompanied by the two worst stock market crashes since the Great Depression. As a long term investor, this makes me feel pretty good about the current situation.
- Even more promising – since the Great Depression, the average length of a recession has been around 10 months. You can find supporting data on this here and here. And the current recession began back in January, so we are already 8 months in.
- In 2 out of the 5 periods, the stock market did great from the start of the recession to peak unemployment, despite the fact that mass layoffs were occurring. With the best period being 1980-82. Oddly enough, that period was driven by the Fed hiking interest rates to combat inflation – which is exactly what is going on now.
- The numbers in the table don’t even include dividends. This simply measures the price level on the S&P 500 index. The average long term dividend yield of the index is 1.85%. As an investor in an index fund, you would receive that dividend every year. So you would expect your numbers to look even better.
Please note: all S&P 500 data is collected here. “Pre-recession” in the table represents the low price during the last week of the month preceding the start of the recession. “Unemployment Peak” represents the high price during the first week of the month following this peak. “5-years out” and “next market peak” represent the weekly high price for the corresponding periods, beginning with the “pre-recession” level. And last but not least, past performance does not indicate future results.